Using Data to Help Geeks Be Better Hackers, What Could Be Better?

Over at dataists John Myles White and I have just announced a new prediction contest tailored to the statistical computing community: Build a Recommendation Engine for R Programmers.

The premise of the contest is as follows:

To win the contest, you need to predict the probability that a user U has a package P installed on their system for every pair, (U, P). We’ll assess your performance using ROC methods, which will be evaluated against a held out test data set. The winning team will receive 3 UseR! books of their choosing. In order to win the contest, you’ll have to provide your analysis code to us by creating a fork of our GitHub repository. You’ll also be required to provide a written description of your approach. We’re asking for so much openness from the winning team because we want this contest to serve as a stepping stone for the R community. We’re also hoping that enterprising data hackers will extend the lessons learned through this contest to other programming languages.

We are very excited about this contest, and hope you will consider participating. It is a great way to improve or test your machine learning skills, and we hope it will encourage collaboration among members of the statistical computing community.

For more info please read the full post, and good luck!

The Data Science Venn Diagram

On Monday I—humbly—joined a group of NYC's most sophisticated thinkers on all things data for a half-day unconference to help O'Reily organize their upcoming Strata conference. The break out sessions were fantastic, and the number of people in each allowed for outstanding, expert driven, discussions. One of the best sessions I attended focused on issues related to teaching data science, which inevitably led to a discussion on the skills needed to be a fully competent data scientist.

As I have said before, I think the term "data science" is a bit of a misnomer, but I was very hopeful after this discussion; mostly because of the utter lack of agreement on what a curriculum on this subject would look like. The difficulty in defining these skills is that the split between substance and methodology is ambiguous, and as such it is unclear how to distinguish among hackers, statisticians, subject matter experts, their overlaps and where data science fits.

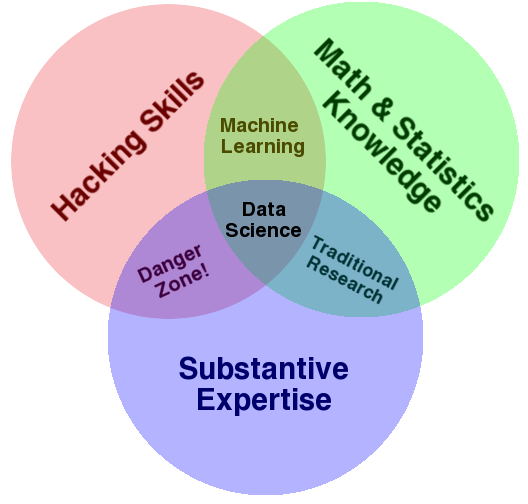
What is clear, however, is that one needs to learn a lot as they aspire to become a fully competent data scientist. Unfortunately, simply enumerating texts and tutorials does not untangle the knots. Therefore, in an effort to simplify the discussion, and add my own thoughts to what is already a crowded market of ideas, I present the Data Science Venn Diagram.


Data_Science_VD.png

How to read the Data Science Venn Diagram

The primary colors of data: hacking skills, math and stats knowledge, and substantive expertise

  • On Monday we spent a lot of time talking about "where" a course on data science might exist at a university. The conversation was largely rhetorical, as everyone was well aware of the inherent interdisciplinary nature of the these skills; but then, why have I highlighted these three? First, none is discipline specific, but more importantly, each of these skills are on their own very valuable, but when combined with only one other are at best simply not data science, or at worst downright dangerous.
  • For better or worse, data is a commodity traded electronically; therefore, in order to be in this market you need to speak hacker. This, however, does not require a background in computer science—in fact—many of the most impressive hackers I have met never took a single CS course. Being able to manipulate text files at the command-line, understanding vectorized operations, thinking algorithmically; these are the hacking skills that make for a successful data hacker.
  • Once you have acquired and cleaned the data, the next step is to actually extract insight from it. In order to do this, you need to apply appropriate math and statistics methods, which requires at least a baseline familiarity with these tools. This is not to say that a PhD in statistics in required to be a competent data scientist, but it does require knowing what an ordinary least squares regression is and how to interpret it.
  • In the third critical piece—substance—is where my thoughts on data science diverge from most of what has already been written on the topic. To me, data plus math and statistics only gets you machine learning, which is great if that is what you are interested in, but not if you are doing data science. Science is about discovery and building knowledge, which requires some motivating questions about the world and hypotheses that can be brought to data and tested with statistical methods. On the flip-side, substantive expertise plus math and statistics knowledge is where most traditional researcher falls. Doctoral level researchers spend most of their time acquiring expertise in these areas, but very little time learning about technology. Part of this is the culture of academia, which does not reward researchers for understanding technology. That said, I have met many young academics and graduate students that are eager to bucking that tradition.
  • Finally, a word on the hacking skills plus substantive expertise danger zone. This is where I place people who, "know enough to be dangerous," and is the most problematic area of the diagram. In this area people who are perfectly capable of extracting and structuring data, likely related to a field they know quite a bit about, and probably even know enough R to run a linear regression and report the coefficients; but they lack any understanding of what those coefficients mean. It is from this part of the diagram that the phrase "lies, damned lies, and statistics" emanates, because either through ignorance or malice this overlap of skills gives people the ability to create what appears to be a legitimate analysis without any understanding of how they got there or what they have created. Fortunately, it requires near willful ignorance to acquire hacking skills and substantive expertise without also learning some math and statistics along the way. As such, the danger zone is sparsely populated, however, it does not take many to produce a lot of damage.

I hope this brief illustration has provided some clarity into what data science is and what it takes to get there. By considering these questions at a high level it prevents the discussion from degrading into minutia, such as specific tools or platforms, which I think hurts the conversation.

I am sure I have overlooked many important things, but again the purpose was not to be speific. As always, I welcome any and all comments.

Cross-posed at dataists


The Data Science Venn Diagram is Creative Commons licensed as Attribution-NonCommercial.

Security Incidents and Voter Turnout in the 2009 Afghanistan Presidential Election

Note: Apologies for my recent lack of posts. As if often the case around this time of year, it takes some time to adjust to my new schedule and blogging tends to get pushed to the bottom of the stack. While I will continue to blog regularly, given the many projects I am involved in this Fall the frequency will very likely be lower than it has been over the past several months. Hopefully, however, the quality will be as good or better.

As many of you know, over the weekend Afghanistan held Parliamentary elections. In preparation for the election, noted observer of all things Afghanistan Joshua Foust wrote a column enumerating five key things to watch in the election. Number two was "There will be blood," asserting that these elections would be victim to large-scale Taliban attacks. As it turns out, however, by Afghan standard they were not particularly violent.

As Foust notes in a post-election follow up:

There were hundreds of election-related security incidents around Afghanistan on Saturday — just over 300, according to the defense minister. Across the country 63 polling stations were attacked with rockets, causing voters to run away from polling stations, and there was at least one suicide bomber. But that compares favorably to the 479 incidents of election violence during the 2009 presidential election. While it remains intolerable that so much violence mars the election, a 37% reduction in it is surely a good thing.

This is a curiosity, as Foust notes in his pre-election piece the Taliban were very explicit in their intentions to attack. Why, then, were so fewer attacks reported? One possible explanations is that fear is a much more cost-effective method for dissuading voters from voting than actual violence. That is, it is much easier to say you are going to attack people, hoping they will take you at your word, than it is to actually coordinate and execute an attack. Another, or perhaps related, reason is that such attacks are ineffective at affecting voter turnout.

To test this theory we could examine how the number of security incidents in each province of Afghanistan affected reported voter turnout in those provinces for the previous election. Fortunately, the Afghanistan Election Data project provides data on both the number of security incidents and voter turnout in the 2009 presidential election. By aggregating this data to the provincial level we can examine what—if any—relationship exists between the number security incidents and voter turnout in this case.

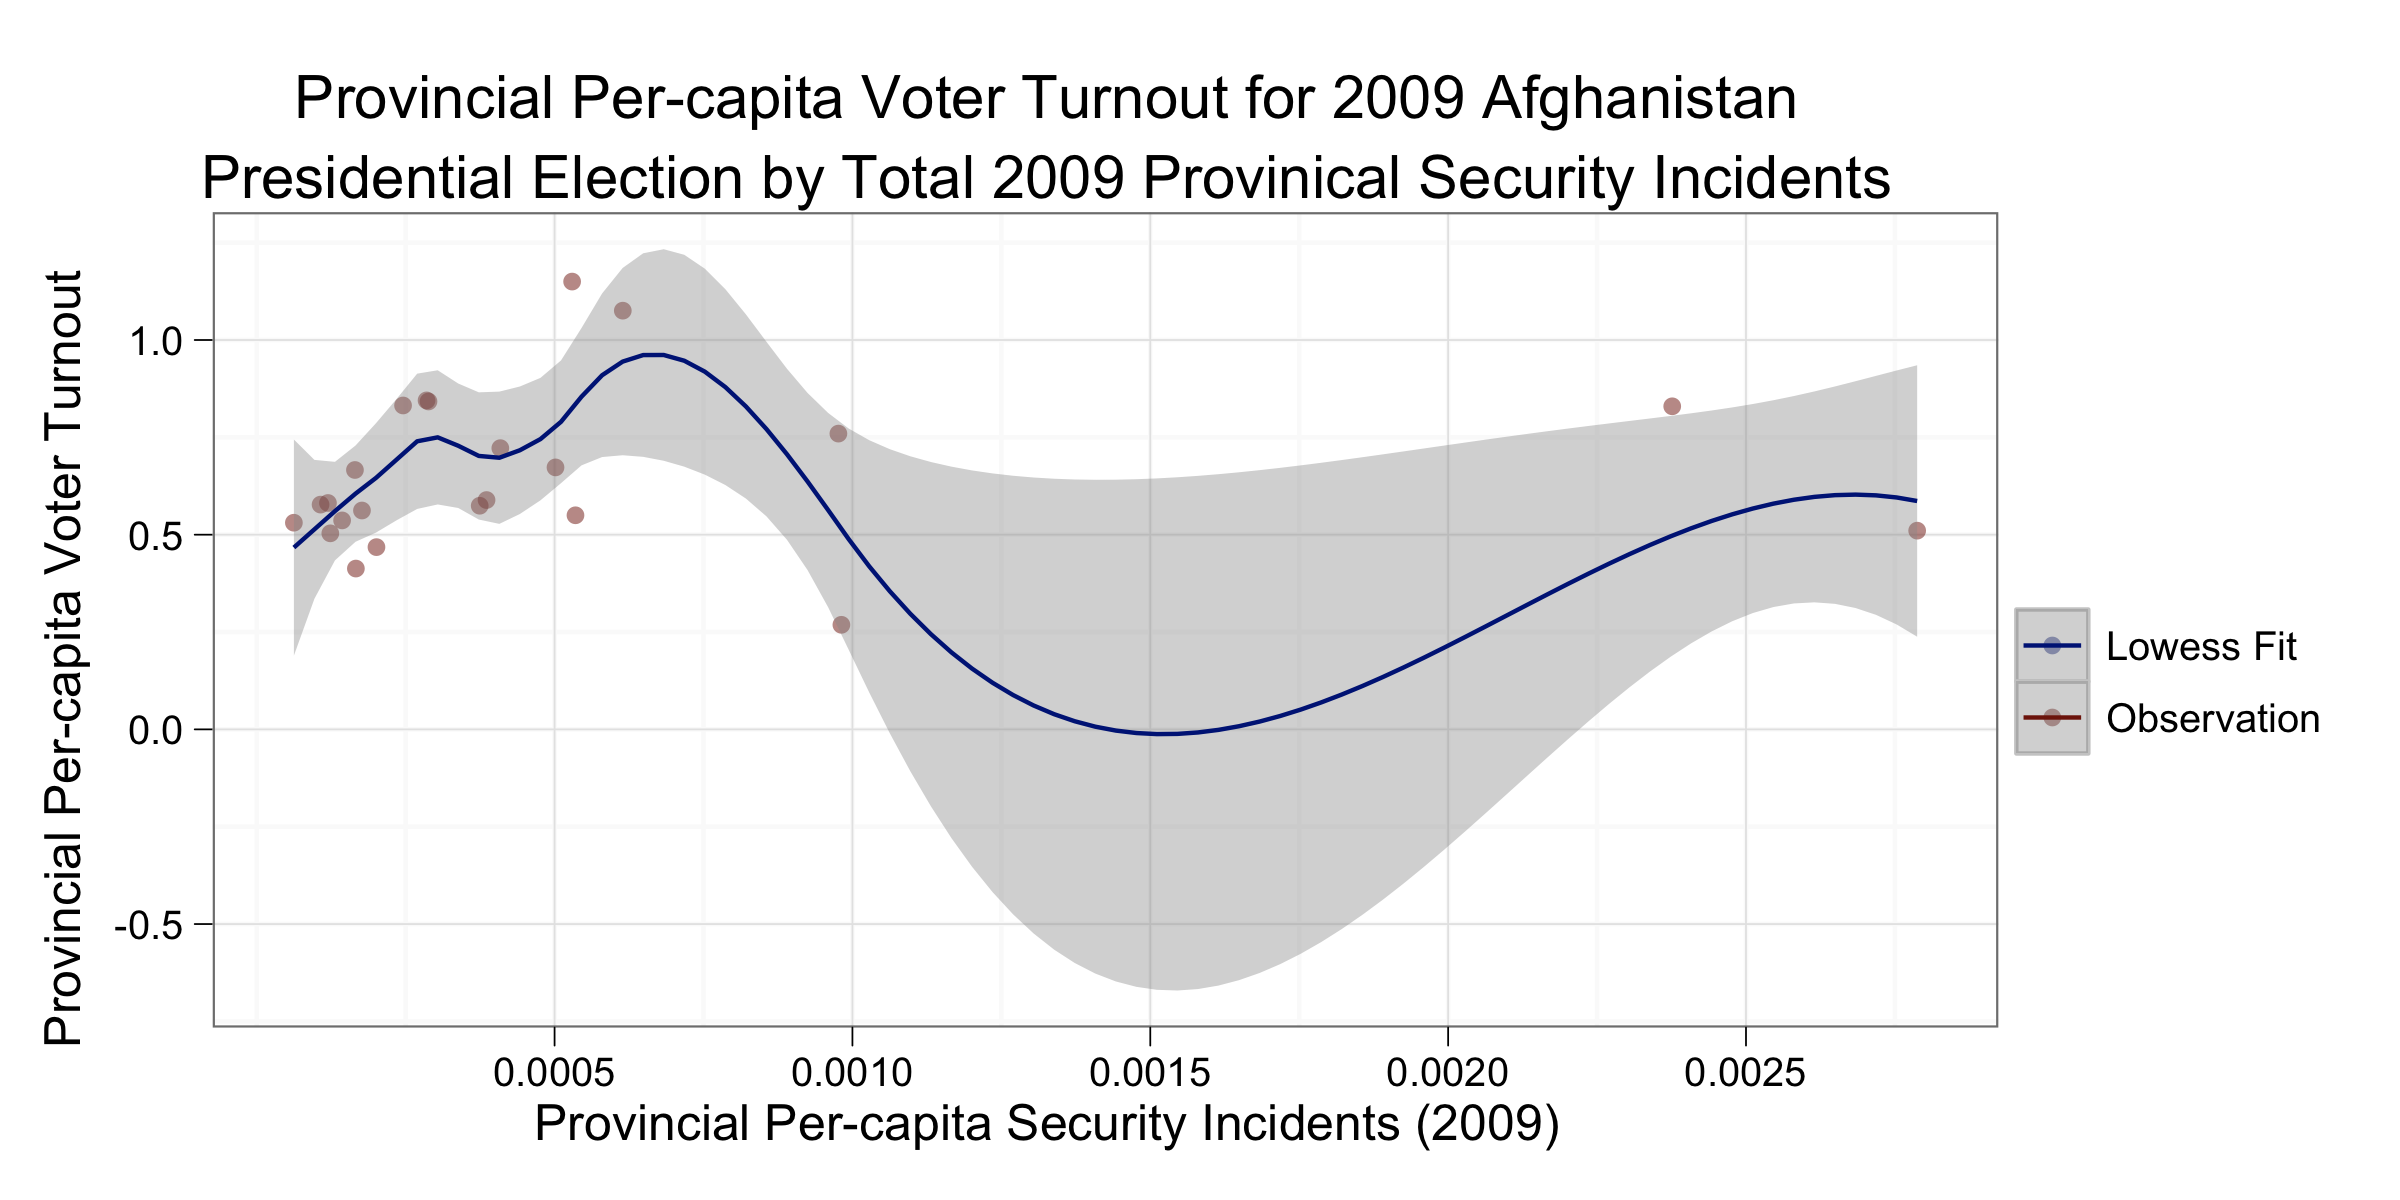
Below are two scatter plots that attempt to illustrate this. Both have provincial per-capita security incidents in 2009 on the x-axis and provincial per-capita voter turnout in the 2009 presidential election on the y-axis; the difference being the first plot uses a linear fit to estimate a relationship and the second uses a smoothed lowess.

Before proceeding, a brief note on the data. Both the security incidents and voter turnout data are provided at the district level, but 2009 population data is only provided at the provincial level. As such, I aggregated the data up in order to control for population levels in both voter turnout and security incidents. Also, security incident counts cover all of 2009, but the presidential election occurred in September of that year. As such, some number of the observations in this data set will have occurred after the elections; however, given that September is relatively late in the year most of the observation occur prior to the election.

prov_lm.png
prov_smooth.png

Interestingly, these plots show no discernible relationship between security incidents and voter turnout. The linear fit is basically flat, and the smoothed fit has multiple peaks and valleys. The level of aggregation needed to match all data points has reduced the level of observations to where statistical significance is difficult to test; however, these plots are an easy way to show the lack of relationship. The plots also clearly denote two outliers along the security incident dimension, these are the Farah and Kunarha provinces, and one worry may be that they are skewing the results. As can be observed in the plot below, wherein I have removed these observations, the lowess fit still shows no relationship.

smooth_noout.png

Are the Taliban updating their strategy based on observation from the 2009 election? These data provide some evidence that the number of security incidents have no effect on voter turnout, and if this is true then it makes sense that the Taliban would shift toward a strategy of deception and away from a tactical one.

Clearly, however, a more granular analysis is needed to extract more definitive conclusions from this data. I had hoped to do this using some of the spatial data included in the Afghanistan Election Data files, however, there appears to be a disconnect between the districts reported in the election data and the district contained in the Afghanistan district-level shapefiles. If anyone has expertise in how these mappings work please let me know, and if I can I will do another post with this analysis.

Supporting code available on Github

In Search of Power-laws: WikiLeaks Edition

Yesterday, a commenter reminded me of the very popular hobby among scientists of searching for power-law distributions in large event data. While the commonality of scale invariance in event data is quite well known—particularly with respect to conflict data—this has not prevented many researchers from seeking and finding these patterns in data.

As the commenter notes, it is likely that the WikiLeaks data will soon be annexed into this line of research. Before other researchers examine the distributional properties of these data more thoroughly, it is worth doing a quick exploration to show some of the issues in power-law fishing, and how to avoid them. First, we begin by plotting the WikiLeaks casualty data using the traditional log-log transformation and fitting a linear regression.

kia_freq_mag.png
all_freq_mag.png

The search for power-law distributions often focuses on the scaling parameter: $latex -\alpha$. Scaling parameters where 2 < $latex \alpha$ < 3 are generally accepted as fitting a power-law, thus the search is for values in that range.

When using linear regression to fit the distribution this parameter is calculated simply as the slope of the linear fit to the logged data. The above panels show this analysis for two different version of the data. On the left, the data are restricted to only observations with, in the words of Lewis Richardson, "deadly quarrels." That is, WikiLeaks events where a death occurred, which accounts for friendly, enemy, host nation and civilian deathsg. Interestingly, we find that for the KIA data the scaling parameter falls just outside the necessary range to be classified as a power-law.

At this point we might conclude that the data does not fit our assumptions and move on to test other distributions. If we were particularly motivated to find a power-law in this data, however, one option would be to go back and loosen our restriction on the data to include not just KIA's but all casualties, i.e., non-deadly quarrels. The assumption being that with more data points the "tail" of the distribution would be longer and thus more likely to fit a power-law. The right panel above illustrates this analysis, and as you can see in this case we find that the data do fit a power-law, with $latex -\alpha = 2.08$.

Unfortunately, even if suspending disbelief enough to accept the altogether dubious inclusion of more data points to force-fit a power-law, everything we have done up to this point is wrong. As was brilliantly detailed by Clauset, et al in "Power-law distributions in empirical data," linear fits to log transformed data are extremely error-prone. As such, rather than rely on the above findings we will use the method detailed by these authors for properly fitting power-law on the WikiLeaks data.

In this case we need to do three things: 1) find the appropriate lower-bound for the value of $latex x$ for our data, which in this case are events with casualties; 2) fit the scaling parameter with $latex x_{min}$; 3) perform a goodness-of-fit test to test whether our empirical observations actually fit the parameterization of the distribution.

For the first step we are fortunate, as we know the appropriate minimum value $latex x_{min}=1$, since these are discrete event data and we are counting the number of observed casualties in the data. Equally convenient, this allows for a straightforward maximum-likelihood estimation of the scaling parameter via a variant of the well-known Hill estimator. This functionality is built-into R's igraph package so we can compute the new scaling parameters easily.

Using this more accurate methods for estimating the scaling parameter reveals that—in fact—neither set of data on the frequency and magnitude of violent events in Afghanistan fit a power-law. As a result, goodness-of-fit tests for power-law with this data are unnecessary, but as described in Clauset, et al. using a Kolmogorov–Smirnov test to measure the distance between theorized and observed distributions is a useful tool for checking fits to other distributions. There are several alternative distributions that may better fit these data, many of which are specified for simulation in the degreenet R package, but I leave that as an exercise to the reader.

There are two primary things to take away from this exercise: 1) power-laws are much less frequently observed than is commonly thought, and careful estimation of scaling parameters and goodness-of-fit should be performed to check; 2) it appears that the WikiLeaks data fall well short of proving, or even reinforcing, previous conclusions about the underlying dynamics of violent conflict.

As always, the code used to generate this analysis is available on Github.