
Security Incidents and Voter Turnout in the 2009 Afghanistan Presidential Election
Note: Apologies for my recent lack of posts. As if often the case around this time of year, it takes some time to adjust to my new schedule and blogging tends to get pushed to the bottom of the stack. While I will continue to blog regularly, given the many projects I am involved in this Fall the frequency will very likely be lower than it has been over the past several months. Hopefully, however, the quality will be as good or better.
As many of you know, over the weekend Afghanistan held Parliamentary elections. In preparation for the election, noted observer of all things Afghanistan Joshua Foust wrote a column enumerating five key things to watch in the election. Number two was "There will be blood," asserting that these elections would be victim to large-scale Taliban attacks. As it turns out, however, by Afghan standard they were not particularly violent.
As Foust notes in a post-election follow up:
There were hundreds of election-related security incidents around Afghanistan on Saturday — just over 300, according to the defense minister. Across the country 63 polling stations were attacked with rockets, causing voters to run away from polling stations, and there was at least one suicide bomber. But that compares favorably to the 479 incidents of election violence during the 2009 presidential election. While it remains intolerable that so much violence mars the election, a 37% reduction in it is surely a good thing.
This is a curiosity, as Foust notes in his pre-election piece the Taliban were very explicit in their intentions to attack. Why, then, were so fewer attacks reported? One possible explanations is that fear is a much more cost-effective method for dissuading voters from voting than actual violence. That is, it is much easier to say you are going to attack people, hoping they will take you at your word, than it is to actually coordinate and execute an attack. Another, or perhaps related, reason is that such attacks are ineffective at affecting voter turnout.
To test this theory we could examine how the number of security incidents in each province of Afghanistan affected reported voter turnout in those provinces for the previous election. Fortunately, the Afghanistan Election Data project provides data on both the number of security incidents and voter turnout in the 2009 presidential election. By aggregating this data to the provincial level we can examine what—if any—relationship exists between the number security incidents and voter turnout in this case.
Below are two scatter plots that attempt to illustrate this. Both have provincial per-capita security incidents in 2009 on the x-axis and provincial per-capita voter turnout in the 2009 presidential election on the y-axis; the difference being the first plot uses a linear fit to estimate a relationship and the second uses a smoothed lowess.
Before proceeding, a brief note on the data. Both the security incidents and voter turnout data are provided at the district level, but 2009 population data is only provided at the provincial level. As such, I aggregated the data up in order to control for population levels in both voter turnout and security incidents. Also, security incident counts cover all of 2009, but the presidential election occurred in September of that year. As such, some number of the observations in this data set will have occurred after the elections; however, given that September is relatively late in the year most of the observation occur prior to the election.

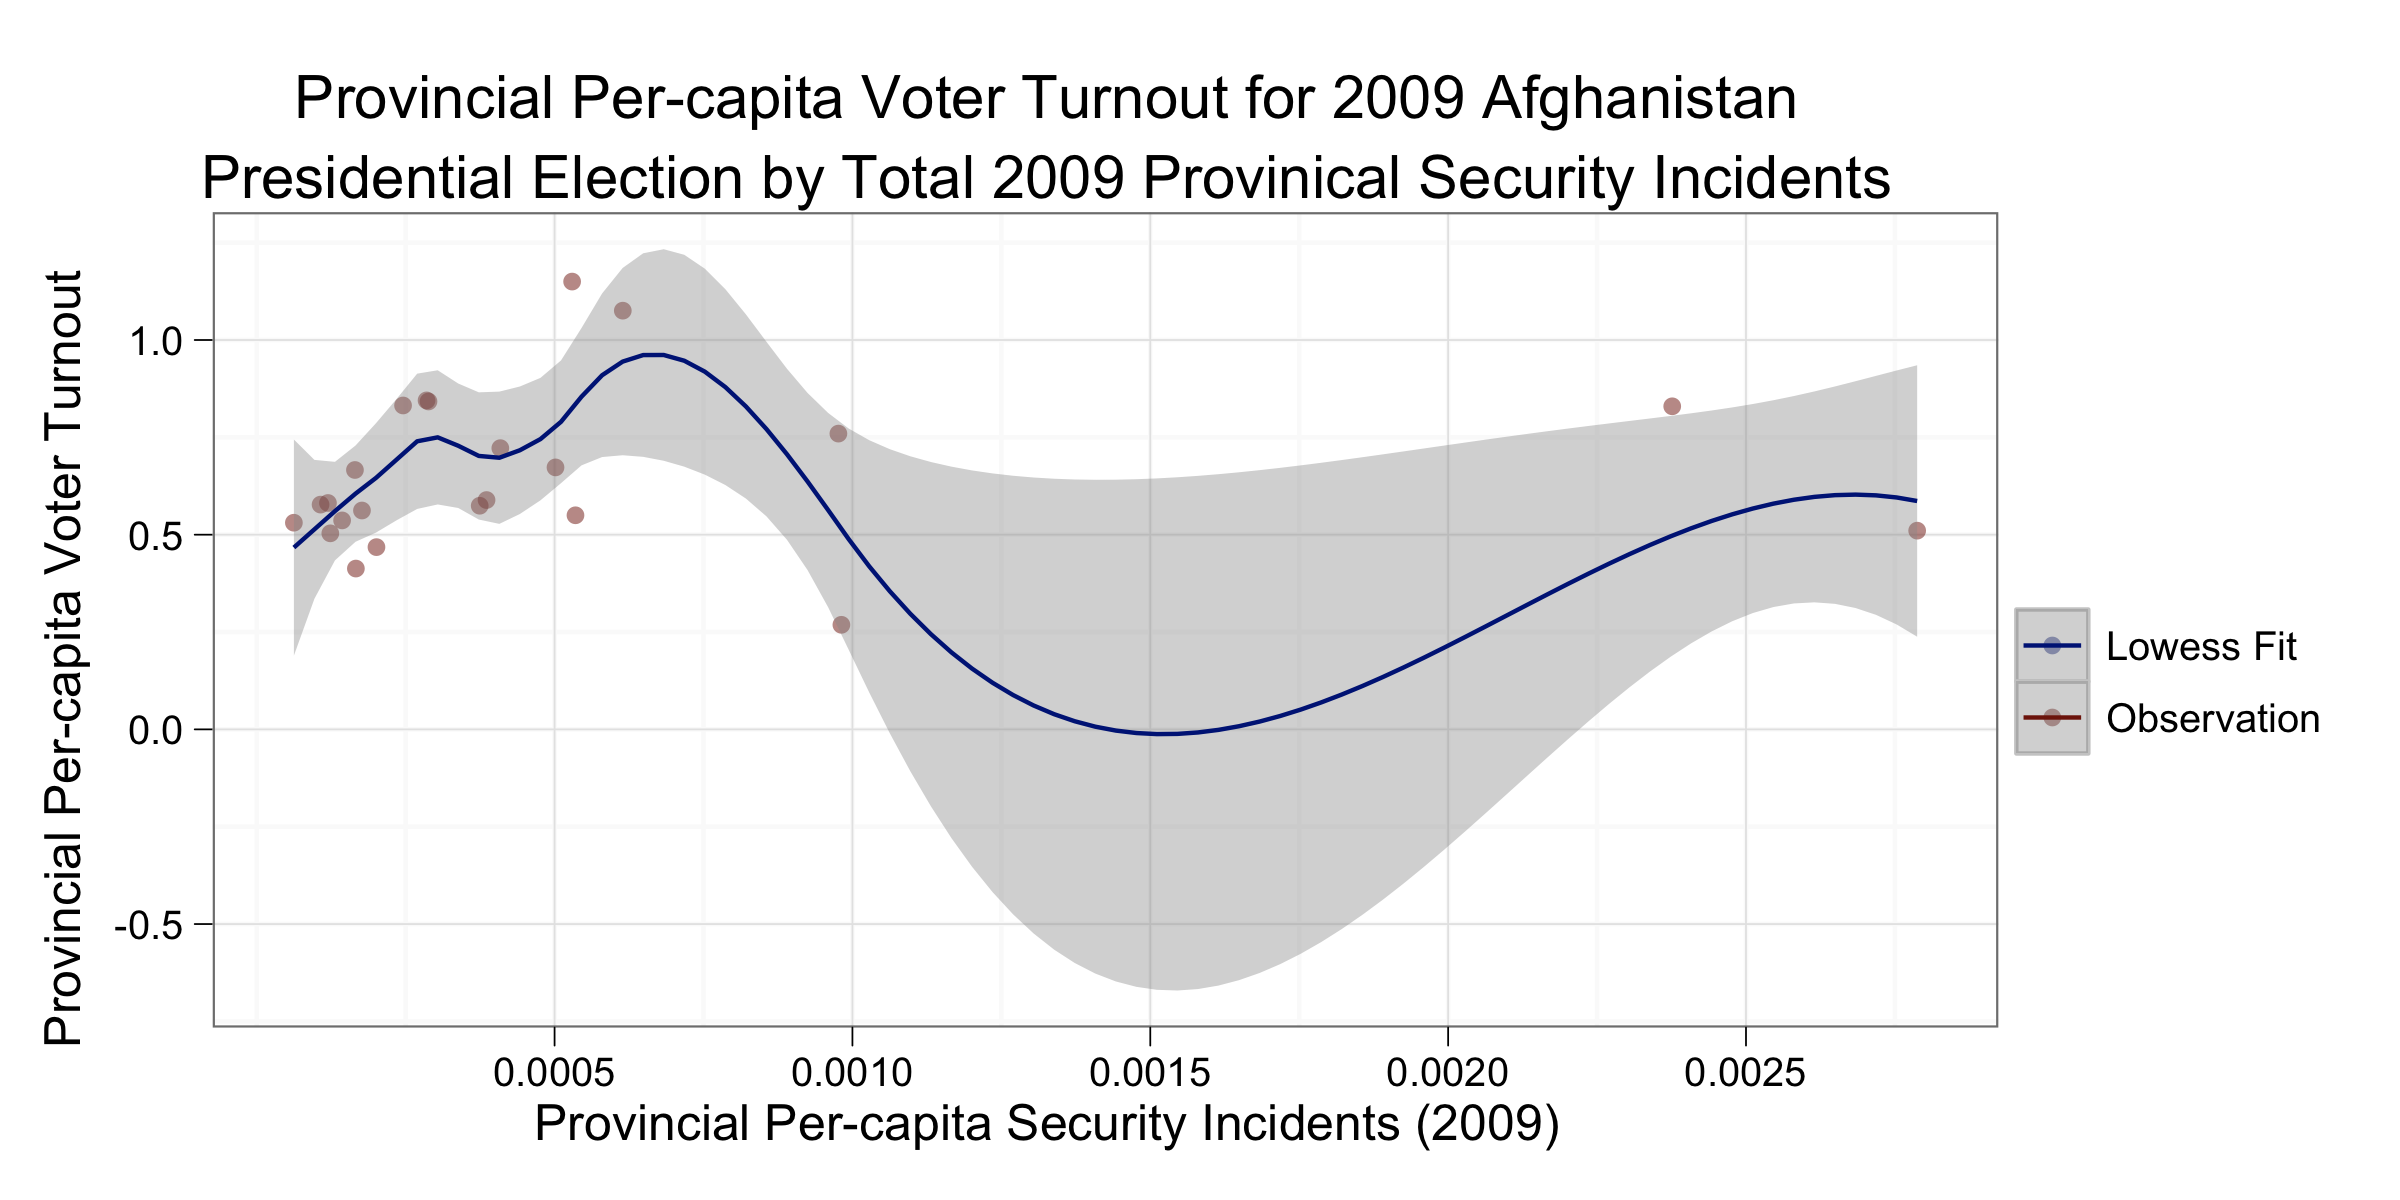
Interestingly, these plots show no discernible relationship between security incidents and voter turnout. The linear fit is basically flat, and the smoothed fit has multiple peaks and valleys. The level of aggregation needed to match all data points has reduced the level of observations to where statistical significance is difficult to test; however, these plots are an easy way to show the lack of relationship. The plots also clearly denote two outliers along the security incident dimension, these are the Farah and Kunarha provinces, and one worry may be that they are skewing the results. As can be observed in the plot below, wherein I have removed these observations, the lowess fit still shows no relationship.

Are the Taliban updating their strategy based on observation from the 2009 election? These data provide some evidence that the number of security incidents have no effect on voter turnout, and if this is true then it makes sense that the Taliban would shift toward a strategy of deception and away from a tactical one.
Clearly, however, a more granular analysis is needed to extract more definitive conclusions from this data. I had hoped to do this using some of the spatial data included in the Afghanistan Election Data files, however, there appears to be a disconnect between the districts reported in the election data and the district contained in the Afghanistan district-level shapefiles. If anyone has expertise in how these mappings work please let me know, and if I can I will do another post with this analysis.
Supporting code available on Github